Get Your AI Weekly Data Report Generator for Team Reporting Needs
Upload an existing XLSX or DOCX file. Get an AI weekly data report generator that creates the next version while preserving formulas, workbook logic, and reporting layout.
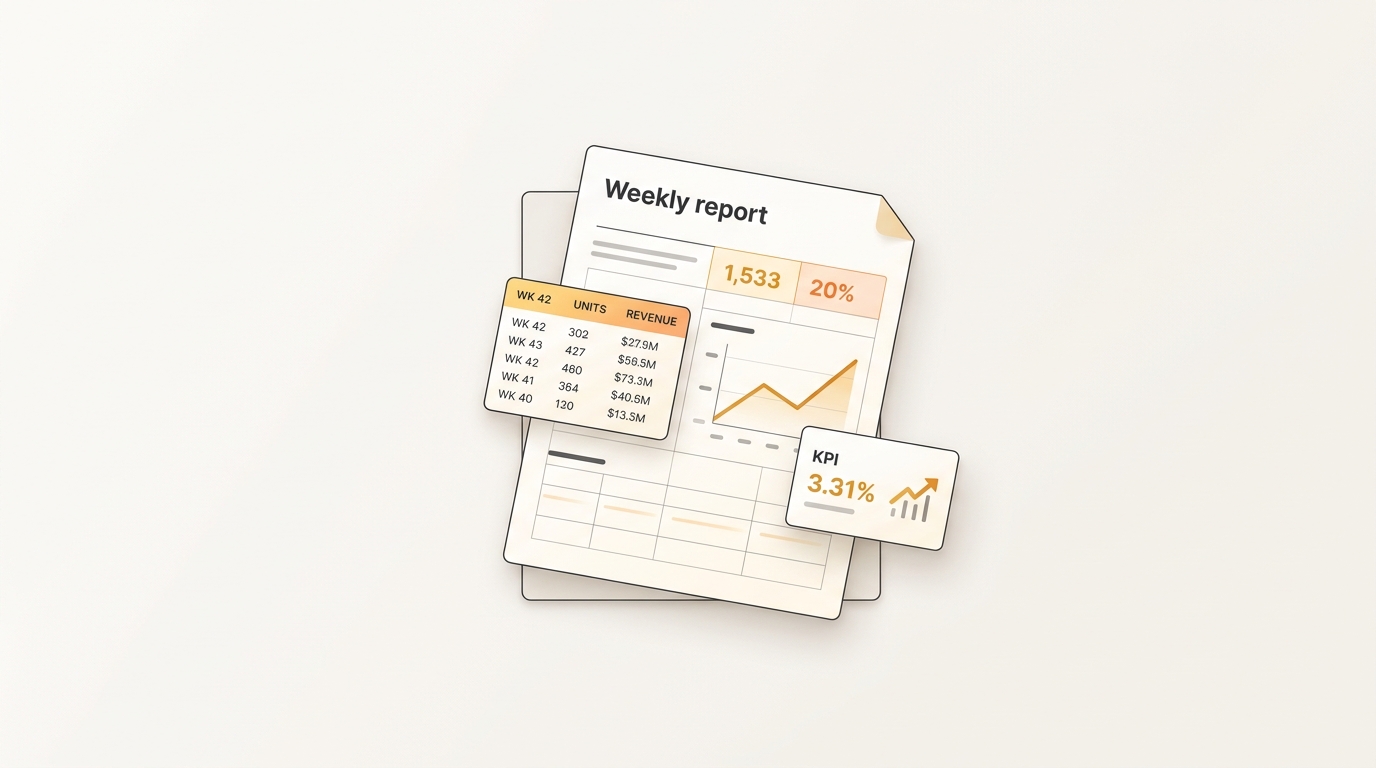
What this Weekly Data report generator creates
- The same data table structure and metric definitions.
- Recurring formulas, charts, and trend views.
- Executive summary sections and commentary style.
- Weekly comparison logic for wins, risks, and next actions.
What the generator preserves from your reference file
Upload one finished weekly data report, ideally the version your team already trusts.
What you can change in each generated version
- The reporting week, channel names, and raw daily data.
- Targets, thresholds, and metric definitions.
- The tone of the written summary for leadership or ops teams.
Example weekly data report generator scenarios
- Growth teams refreshing weekly conversion reports.
- Ops teams reusing an executive weekly reporting template.
- Founders preparing investor update metrics every Friday.
Manual Weekly Data report workflows are slow because structure keeps drifting
A strong weekly data report is not just a block of generated text. It is a repeatable workflow with structure, formatting, decision logic, and a familiar review path. The hard part is keeping that consistency when the next version needs new inputs, a new audience, or a new reporting period.
WriteAsMe solves this by starting from the finished file you already trust. Instead of asking a chat model to invent a generic weekly data report, it uses your reference file as the operating pattern, then generates the next version with repeatable structure and controlled changes.
Formula drift across copied workbooks
Copying last period's spreadsheet by hand makes it easy to break cell references, overwrite assumptions, or leave one hidden calculation pointing at stale data.
Manual data entry slows every cycle
Teams spend time pasting exports, checking totals, and reconciling tabs before they can explain what changed or make a decision.
Charts and summaries lose consistency
When ranges, labels, and commentary are rebuilt manually, the finished file can look familiar while telling the story in a different structure.
How WriteAsMe understands this spreadsheet workflow
WriteAsMe reads the weekly data report as a repeatable spreadsheet workflow, not as loose rows of data. It follows worksheet order, section labels, formulas, chart intent, visual grouping, and the relationship between inputs and outputs. When you provide new values for the reporting week, channel names, and raw daily data., the generated version keeps the workbook structure and updates the parts that should change.
Who uses this repeatable workflow?
Growth marketers and operators
Teams that publish recurring KPI, campaign, or operations reports can keep metrics, commentary, and review cadence consistent without rebuilding the reporting pack.
Founders and department leads
Leaders can turn a trusted update format into a repeatable workflow for investors, managers, or cross-functional stakeholders.
Agencies and client-service teams
Client-facing teams can standardize weekly and monthly reporting while still tailoring the details to each account.
Step-by-Step Implementation Guide for Weekly Data report
Use this workflow when the goal is consistency, not a one-off draft. The setup below keeps reporting cadence, data refresh, and stakeholder narrative aligned from one version to the next.
Upload the strongest finished example
Upload one finished weekly data report, ideally the version your team already trusts. The reference should show the exact structure, formatting, and level of detail you want WriteAsMe to replicate.
Identify what must remain stable
Mark the parts that define the workflow: The same data table structure and metric definitions. Recurring formulas, charts, and trend views. Executive summary sections and commentary style. Weekly comparison logic for wins, risks, and next actions. These become the reusable structure for future generations.
Provide the new inputs in one clear prompt
Change the variables that belong to this run, including The reporting week, channel names, and raw daily data. Targets, thresholds, and metric definitions. The tone of the written summary for leadership or ops teams. This keeps the prompt focused on controlled updates instead of rebuilding the file.
Review, save, and reuse the workflow
Check the generated weekly data report for accuracy, then keep the workflow as the repeatable version for the next cycle, client, role, or scenario.
Industry Best Practices for Consistent Weekly Data report Generation
- Treat the reference report as a control document: define which metrics, labels, and summary sections should remain stable before changing the period or audience.
- Upload editable XLSX files whenever formulas, chart ranges, or workbook tabs matter.
- Keep source data in clearly labeled tables so the workflow can separate inputs from outputs.
This is for repeatable work, not one-off drafting.
A normal AI chat can draft a generic weekly data report. WriteAsMe starts from your own finished file, then preserves the structure, formatting, formulas, charts, section logic, and writing pattern that made it useful.
That means the next version does not begin with re-explaining the template. You upload a trusted example once, change the inputs, and generate a document that follows the same workflow.
FAQ
Do I need a perfect weekly data report to start?
No. A clear finished example is enough. Editable Office files work best when you want to preserve formulas, charts, layouts, or section structure.
Can I change the output after generation?
Yes. You can adjust the prompt, change the inputs, or regenerate a new version from the same workflow.
Will my uploaded files train shared AI models?
No. Your files are used to create and run your own reusable workflow. They are not used to train shared models for other customers.
Related use cases
Reuse a past campaign report for a new launch, keeping the same performance breakdown, charts, learnings, and next-step structure.
Generate the next business review from a past one - with updated KPIs, insights, risks, and action items.
Create recurring operations reports with the same KPI sections, issue tracking, summary format, and action plan structure.
Make your next weekly data report repeatable.
Upload one finished file, turn it into a reusable workflow, and generate the next version with your structure intact.